Module 2: Advanced Excel for Data Analysis
• Why Excel for Data Analysis?
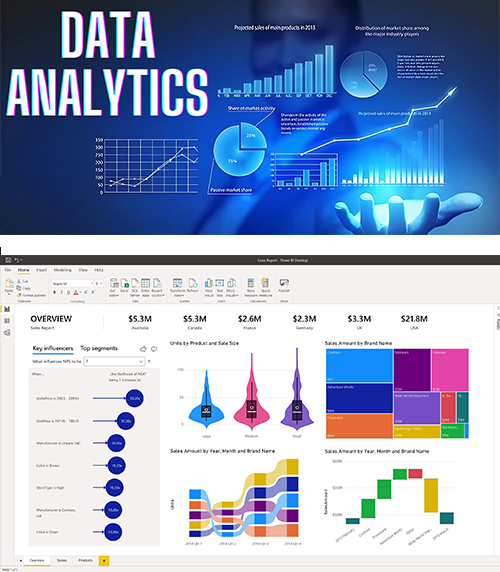
Excel is a powerful and widely-used tool for organizing, analyzing, and visualizing data.
It’s great for beginners and professionals alike due to its flexibility and built-in
functions. Excel is one of the most widely used tools for data analysis; it offers a
comprehensive set of features for cleaning, transforming, analyzing, and visualizing
data. It is especially useful for smaller datasets and is ideal for data exploration.
- Excel environment setup
- Install Microsoft excel
- Set up data sources
- Enable data analysis tool Pak
- Key Excel concepts For Data Analysis
- Data cleaning & transformation
- Remove duplicates
- Text to columns
- Find and replaces
- Filter & sort
- Handling missing data
- Functions & formulas
- Statistical functions
- Average
- Median
- Mode
- Stdev
- Conditional functions.
- If
- Count if
- Sum if
- Lookup Functions
- VLOOKUP
- Index & match
- Data analysis tools
- Power query
- Data validation
- Data visualization
- Charts
- Conditional formatting
- Sparklines
- Formulas & functions
- Nested if
- Data cleaning
- Trim
- Remove duplicates
- Text to columns
- Power query
- Pivot Tables
- Charts and visualization
- Dashboards